Stock Analyzer AI Agent
I enjoy trading stocks for long-term investing because it requires knowledge, analytical skills, and a long-term perspective. Over time, I have developed technical skills in analyzing stock charts to identify patterns, resistance and support levels, and to gauge whether the stock is becoming bearish or bullish. I also enjoy reading news and listening to tech podcasts to stay up-to-date on upcoming trends.
In addition to personal interests, in the era of AGI, wealth is predominantly generated through equity market investments.
A Stock AI Agent
That said, I don’t always have time to watch live stock charts. That makes me want to create a stock app where AI agents analyze the charts and relate them to market sentiment to give trading insights.
Additionally, in many ways, trading stocks is more of a psychological game than a numbers game. Therefore, using AI agents to recommend stock actions can be helpful during major pullbacks when everyone is scared, as well as at market peaks when everyone is greedy. AI has a much calmer mind than we humans. :)
I have a few stocks to start with, but I’d love to add more to the list as the AI agent researches and recommends new stocks in sectors that interest me.
Architecture
Here’s a brief overview of the architecture. The benefit of agent-based design is that:
- It is modular, flexible, and with expert stock analyst intelligence.
- This design supports the “in the loop” evaluation, enabling the Orchestrator agent to oversee and critique the output of other agents, promoting reflection - a key aspect of the agentic reasoning pattern that helps improve performance.
- Additionally, the logging agent records the stock’s insights and feedback to facilitate ongoing iterative review and improvement.
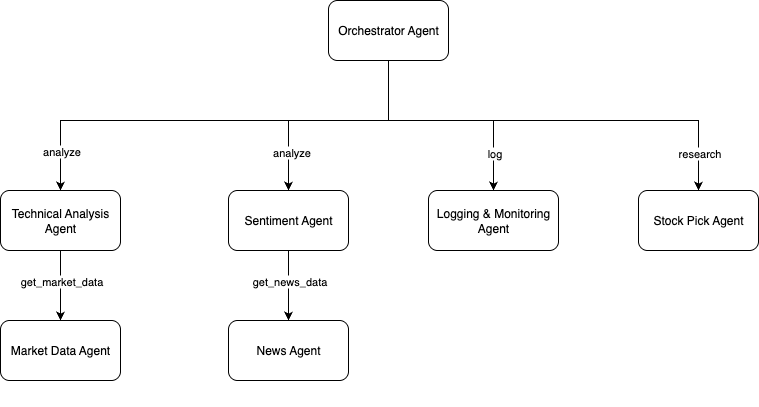
Here are the responsibilities of each agent:
- The Orchestrator Agent initiates the flow (e.g., on schedule or event).
- It instructs the Technical Analysis Agent and Sentiment Agent to analyze the stocks.
- The Technical Agent contacts the Market Data Agent for stock data, and the Sentiment Agent uses the News Agent to fetch news data for the stocks.
- The Orchestrator Agent combines all signals and makes a recommendation.
- All insights are logged by the Logging Agent.
The word “agent” is a general term here. It can refer to a large language model (LLM) or an entity that performs specific tasks. For example:
- The “Technical Analysis Agent” is a large language model. It calculates various technical indicators for stocks and uses reasoning to provide a technical assessment.
- Conversely, the “Market Data Agent” retrieves stock data from the stock exchange.
Technologies
I use ChatGPT-5 as the large language model (LLM) and LangGraph as the agent framework. The AI agent is built with Python and Angular. The web user interface is developed entirely through Cursor, an AI-assisted coding tool.
The agent functions as a REST service with endpoints for on-demand stock analysis requests. It also runs the “watchlist” job in the background to automatically generate insightful alerts for the user.
The Stock Analyzer AI Agent
Here is the Stock Analyzer, the AI agent that offers professional stock technical insights and market sentiment analysis.
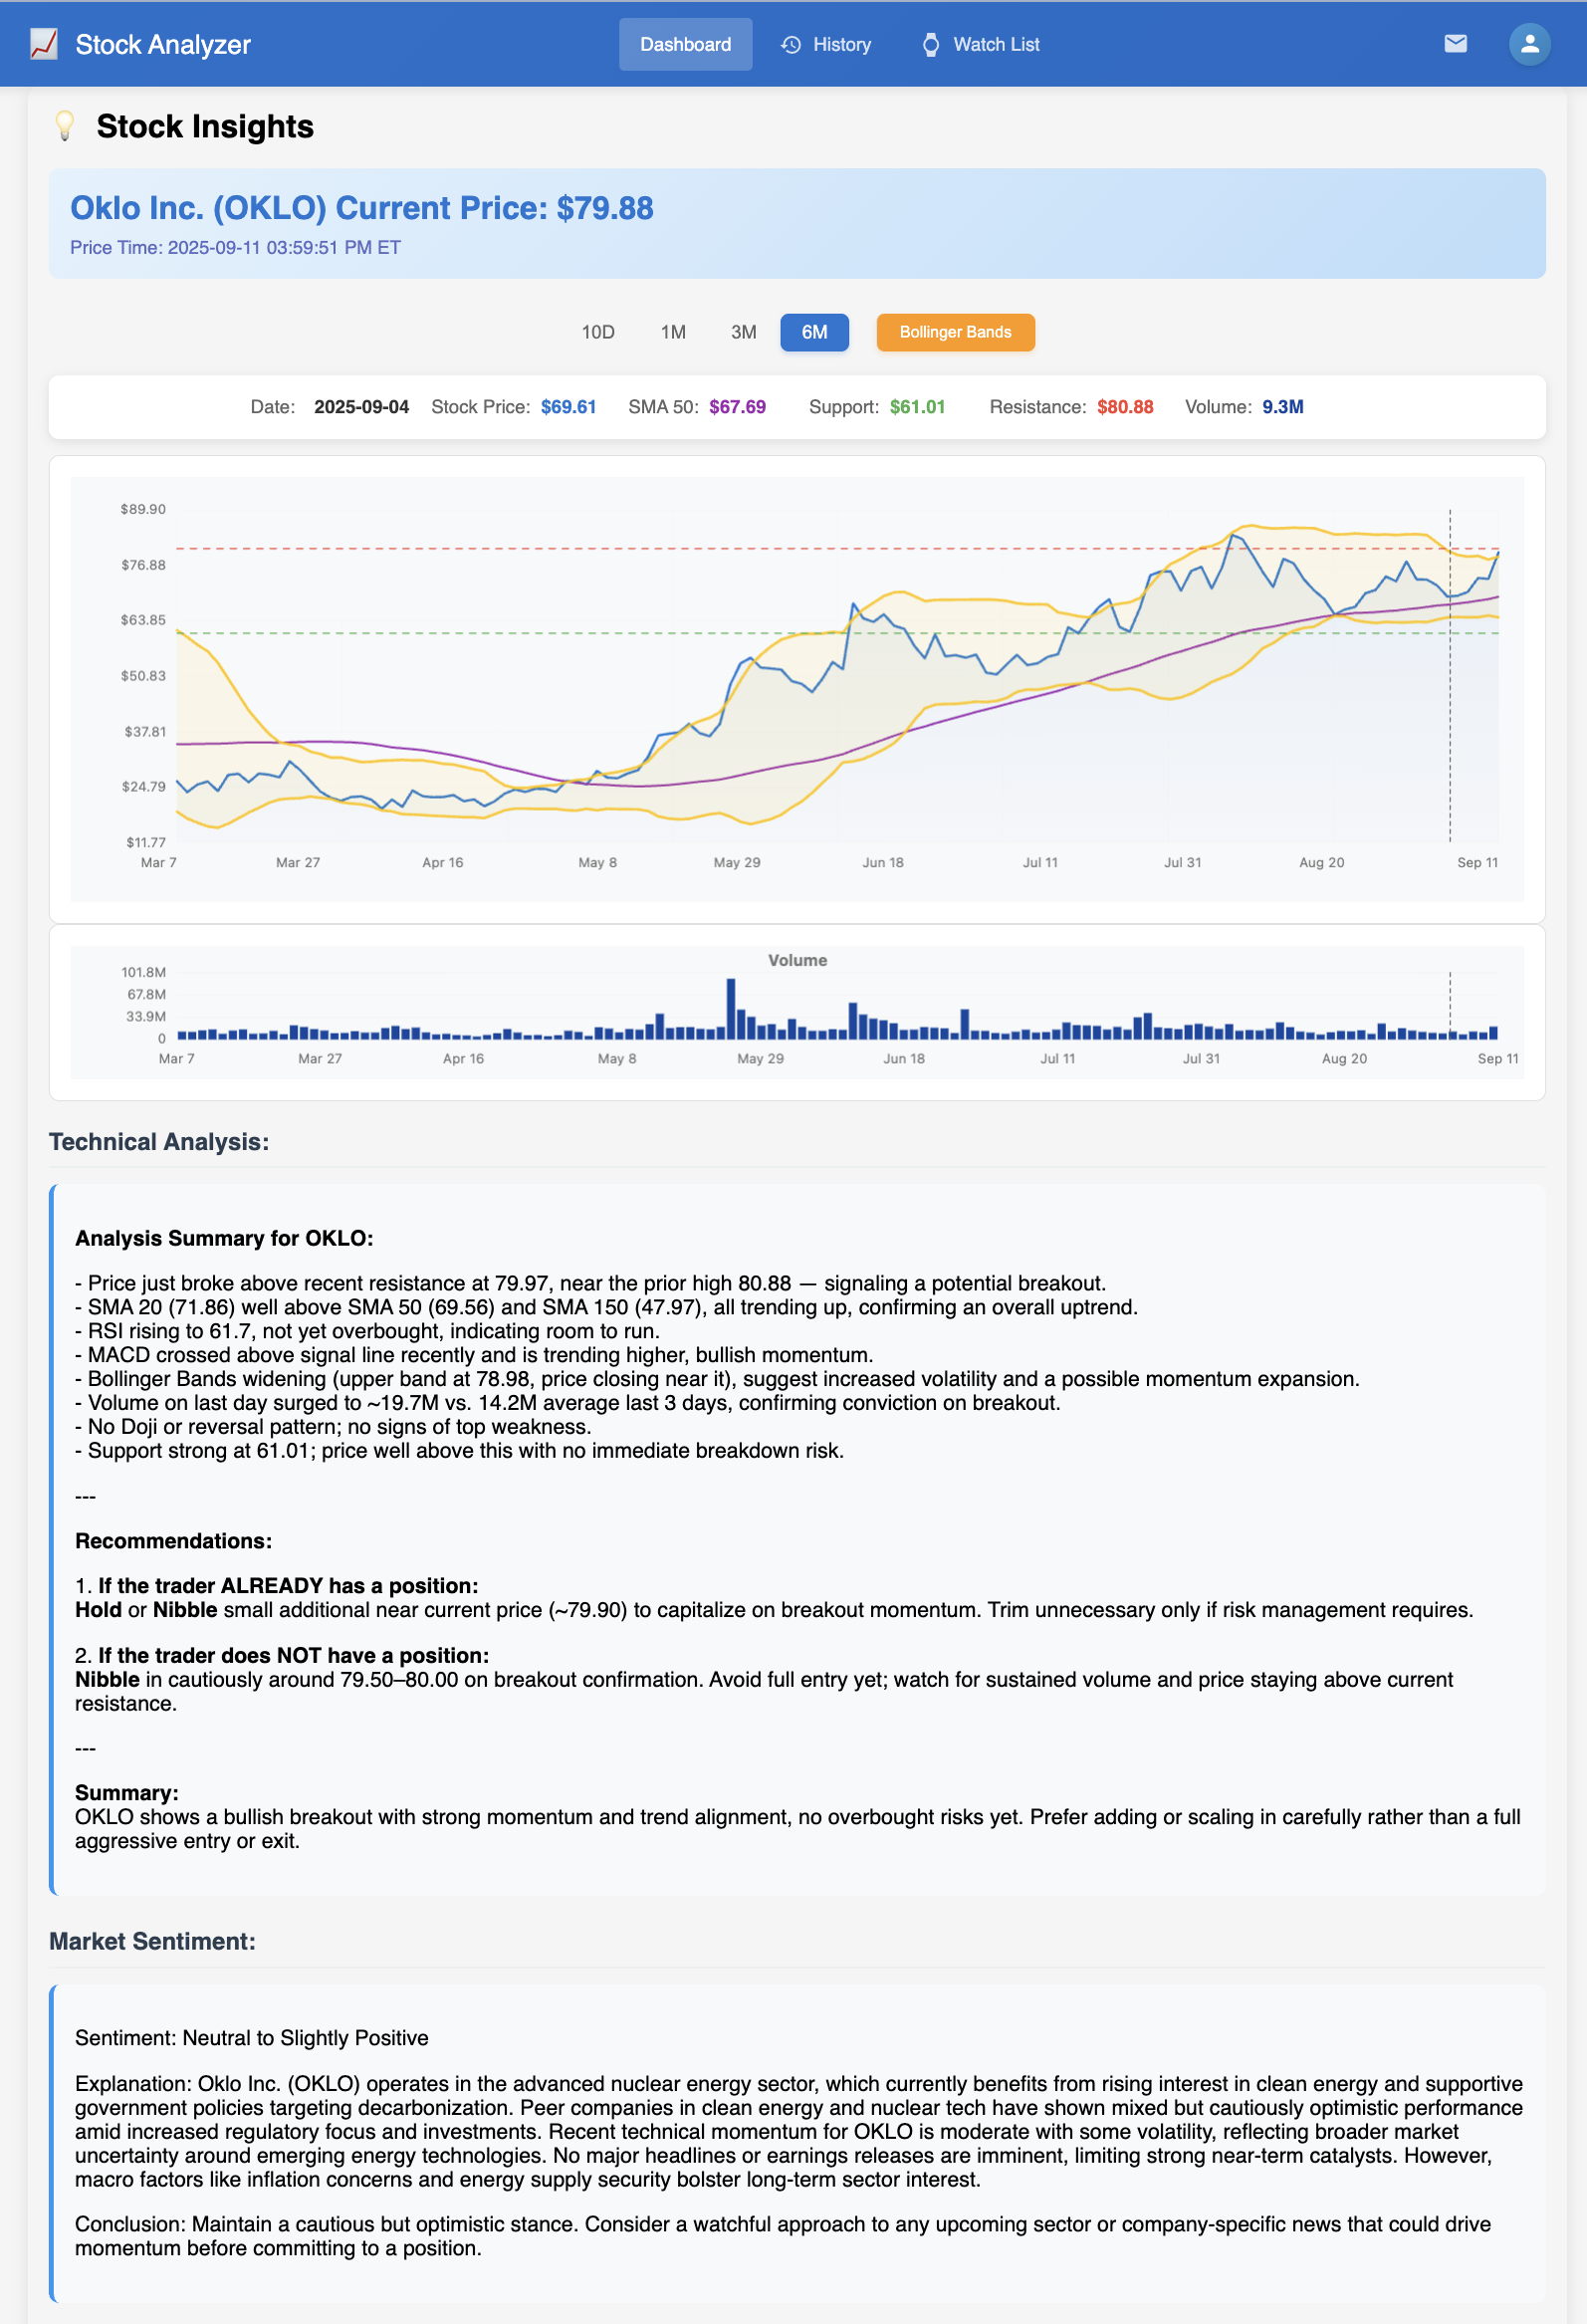
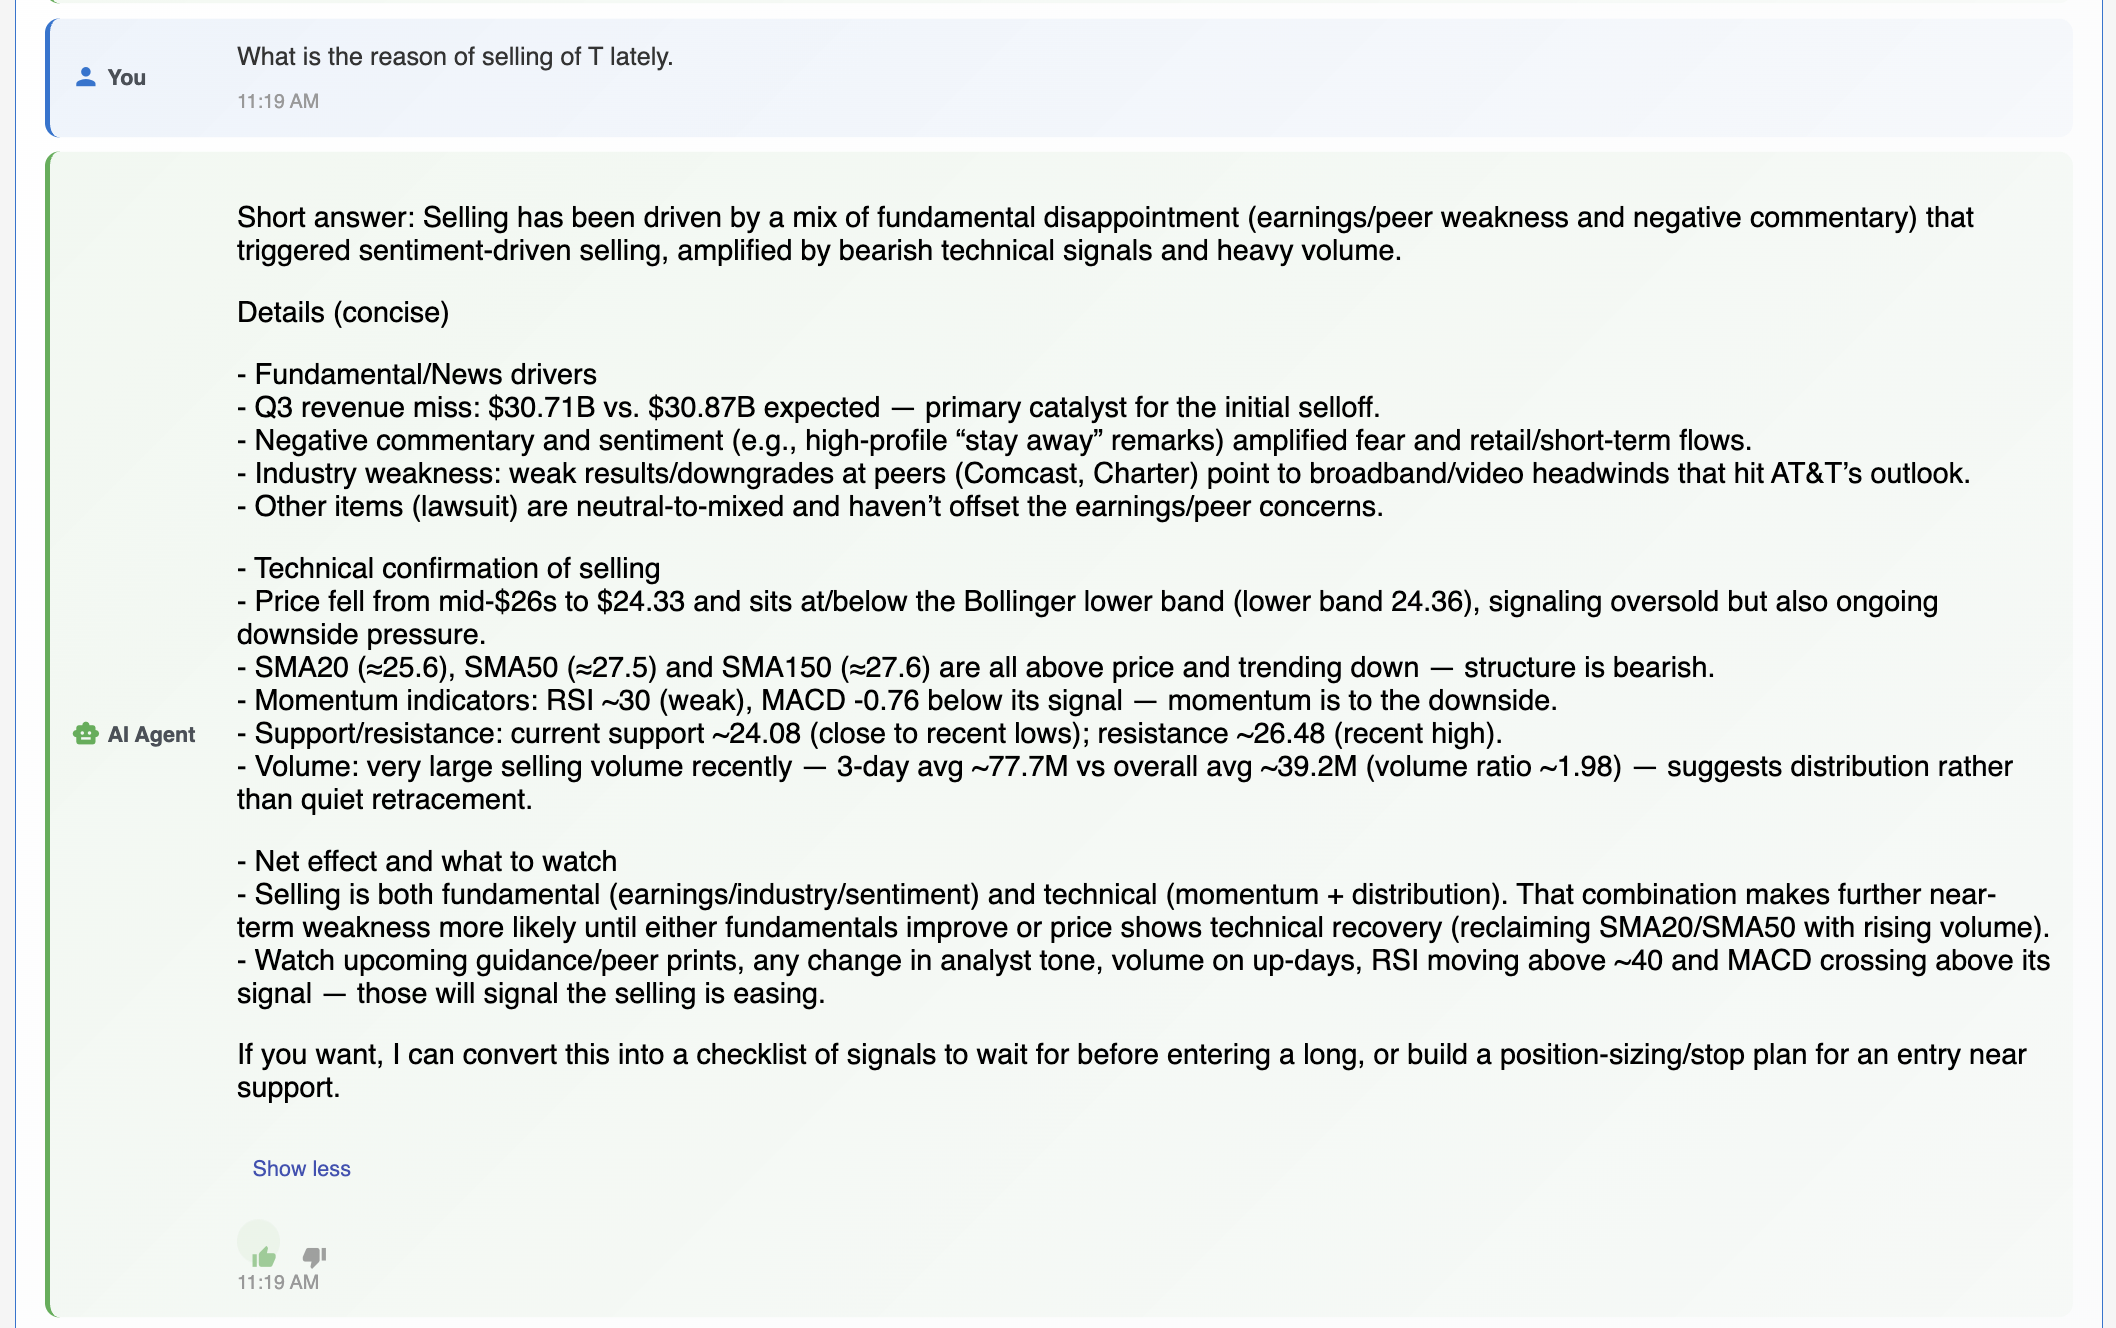
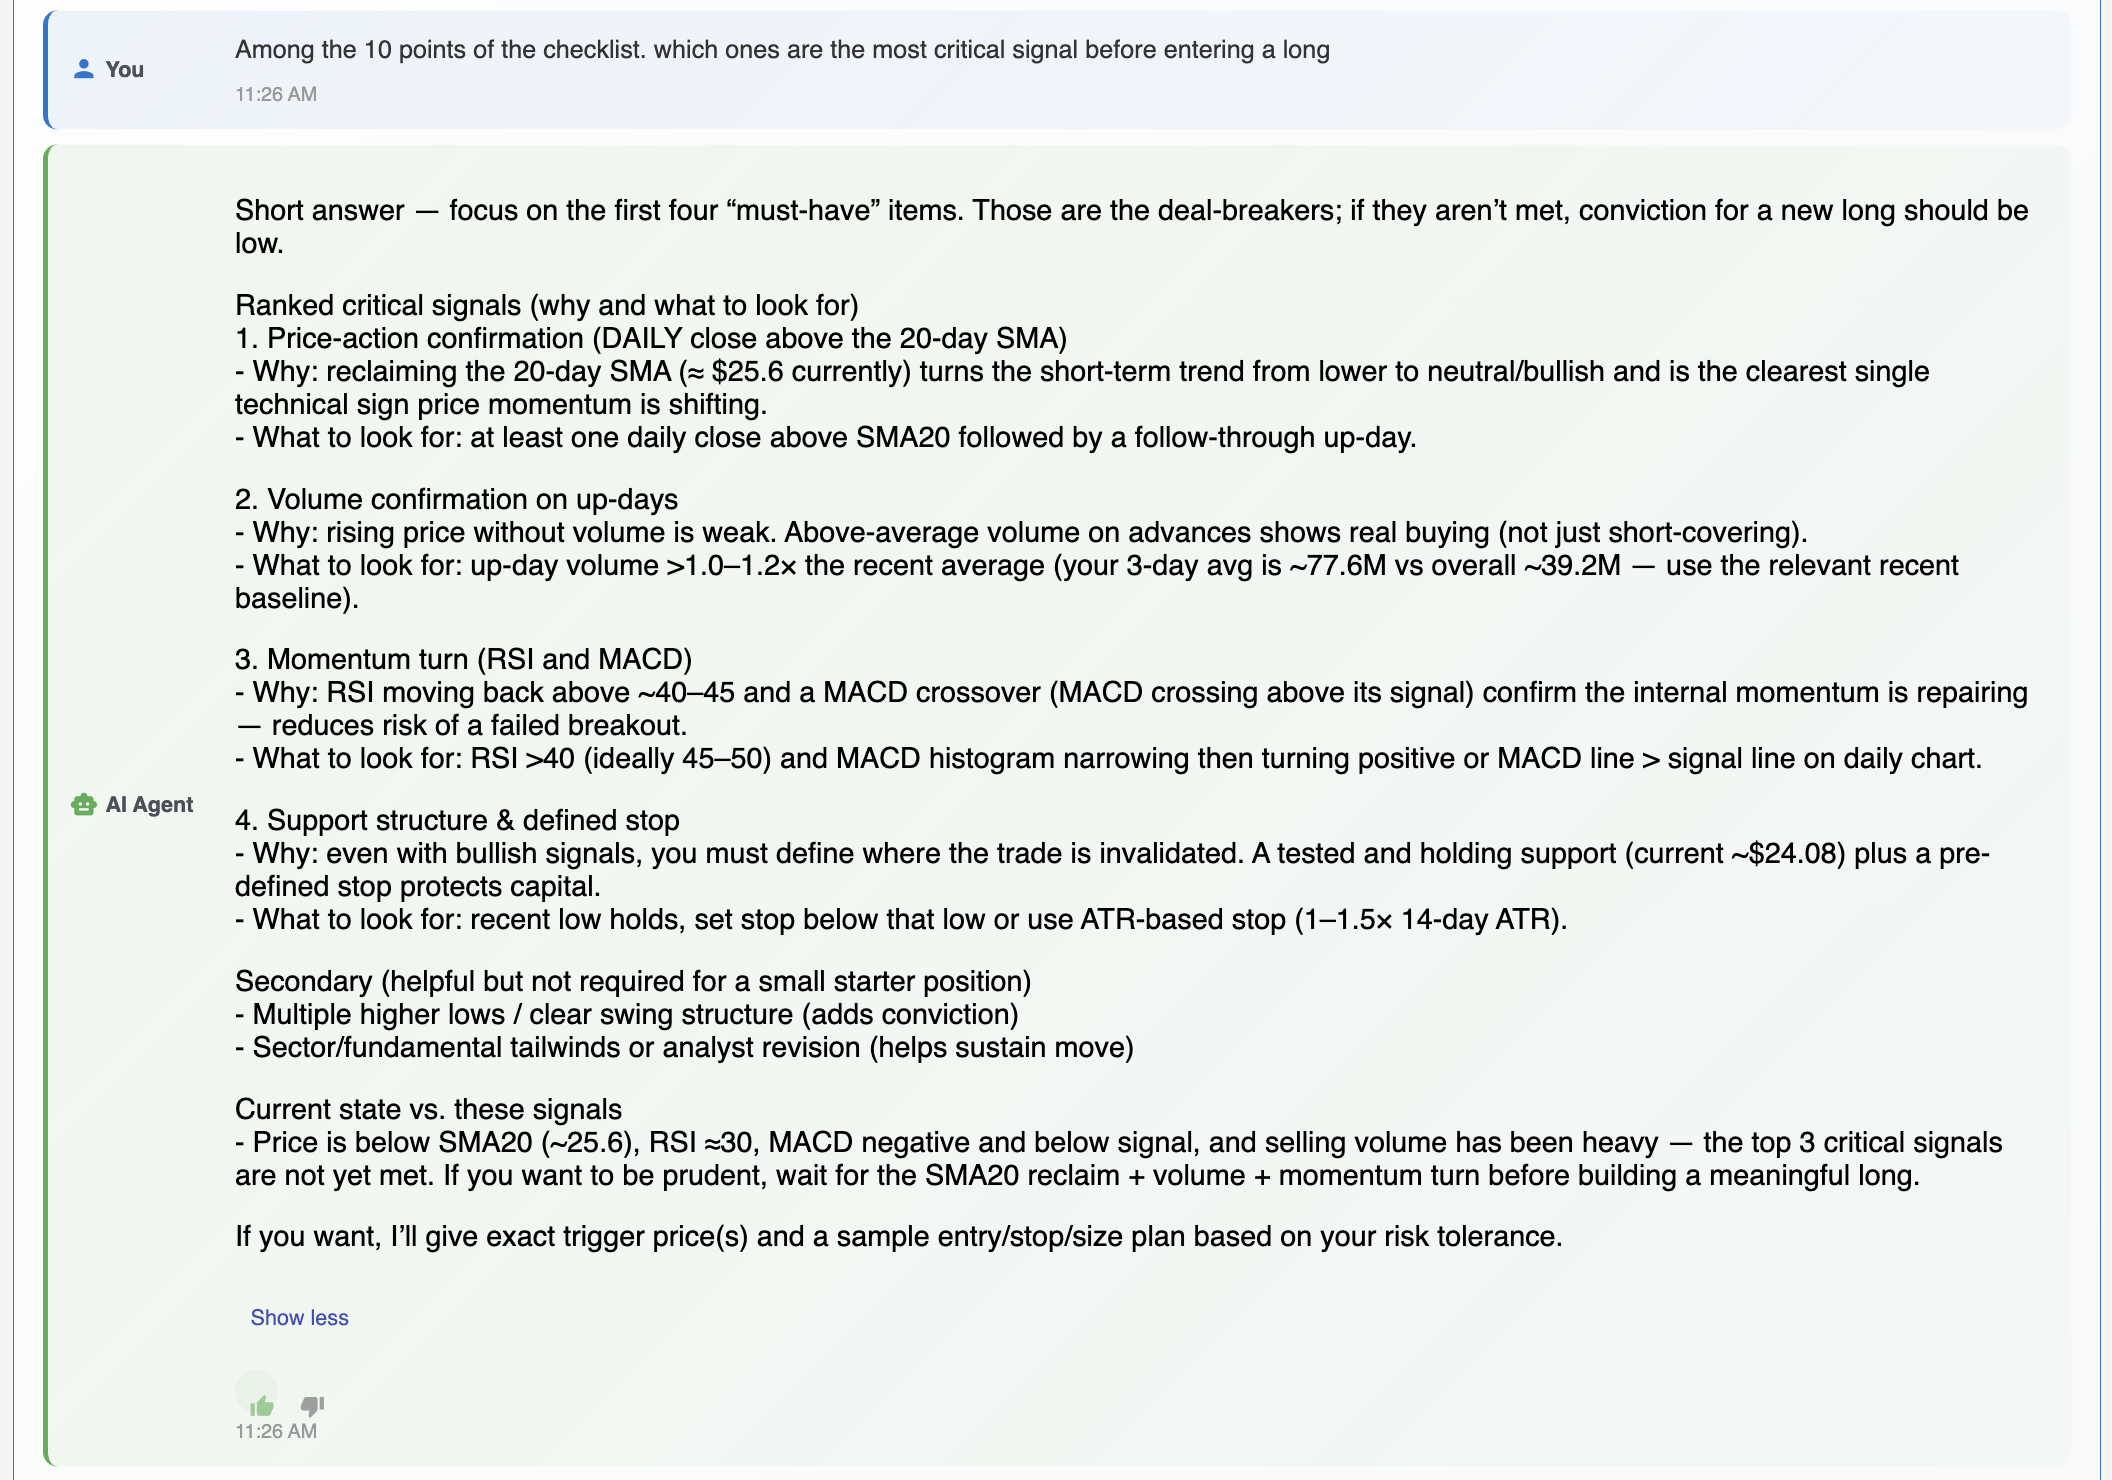
In addition to “Quick Insights,” the user can also chat with the agent about specific stock topics. Unlike a generic chatbot, the agent has access to the stock’s charts and the latest news, so it can provide the user with solid data points for quick decision-making.
Testimony
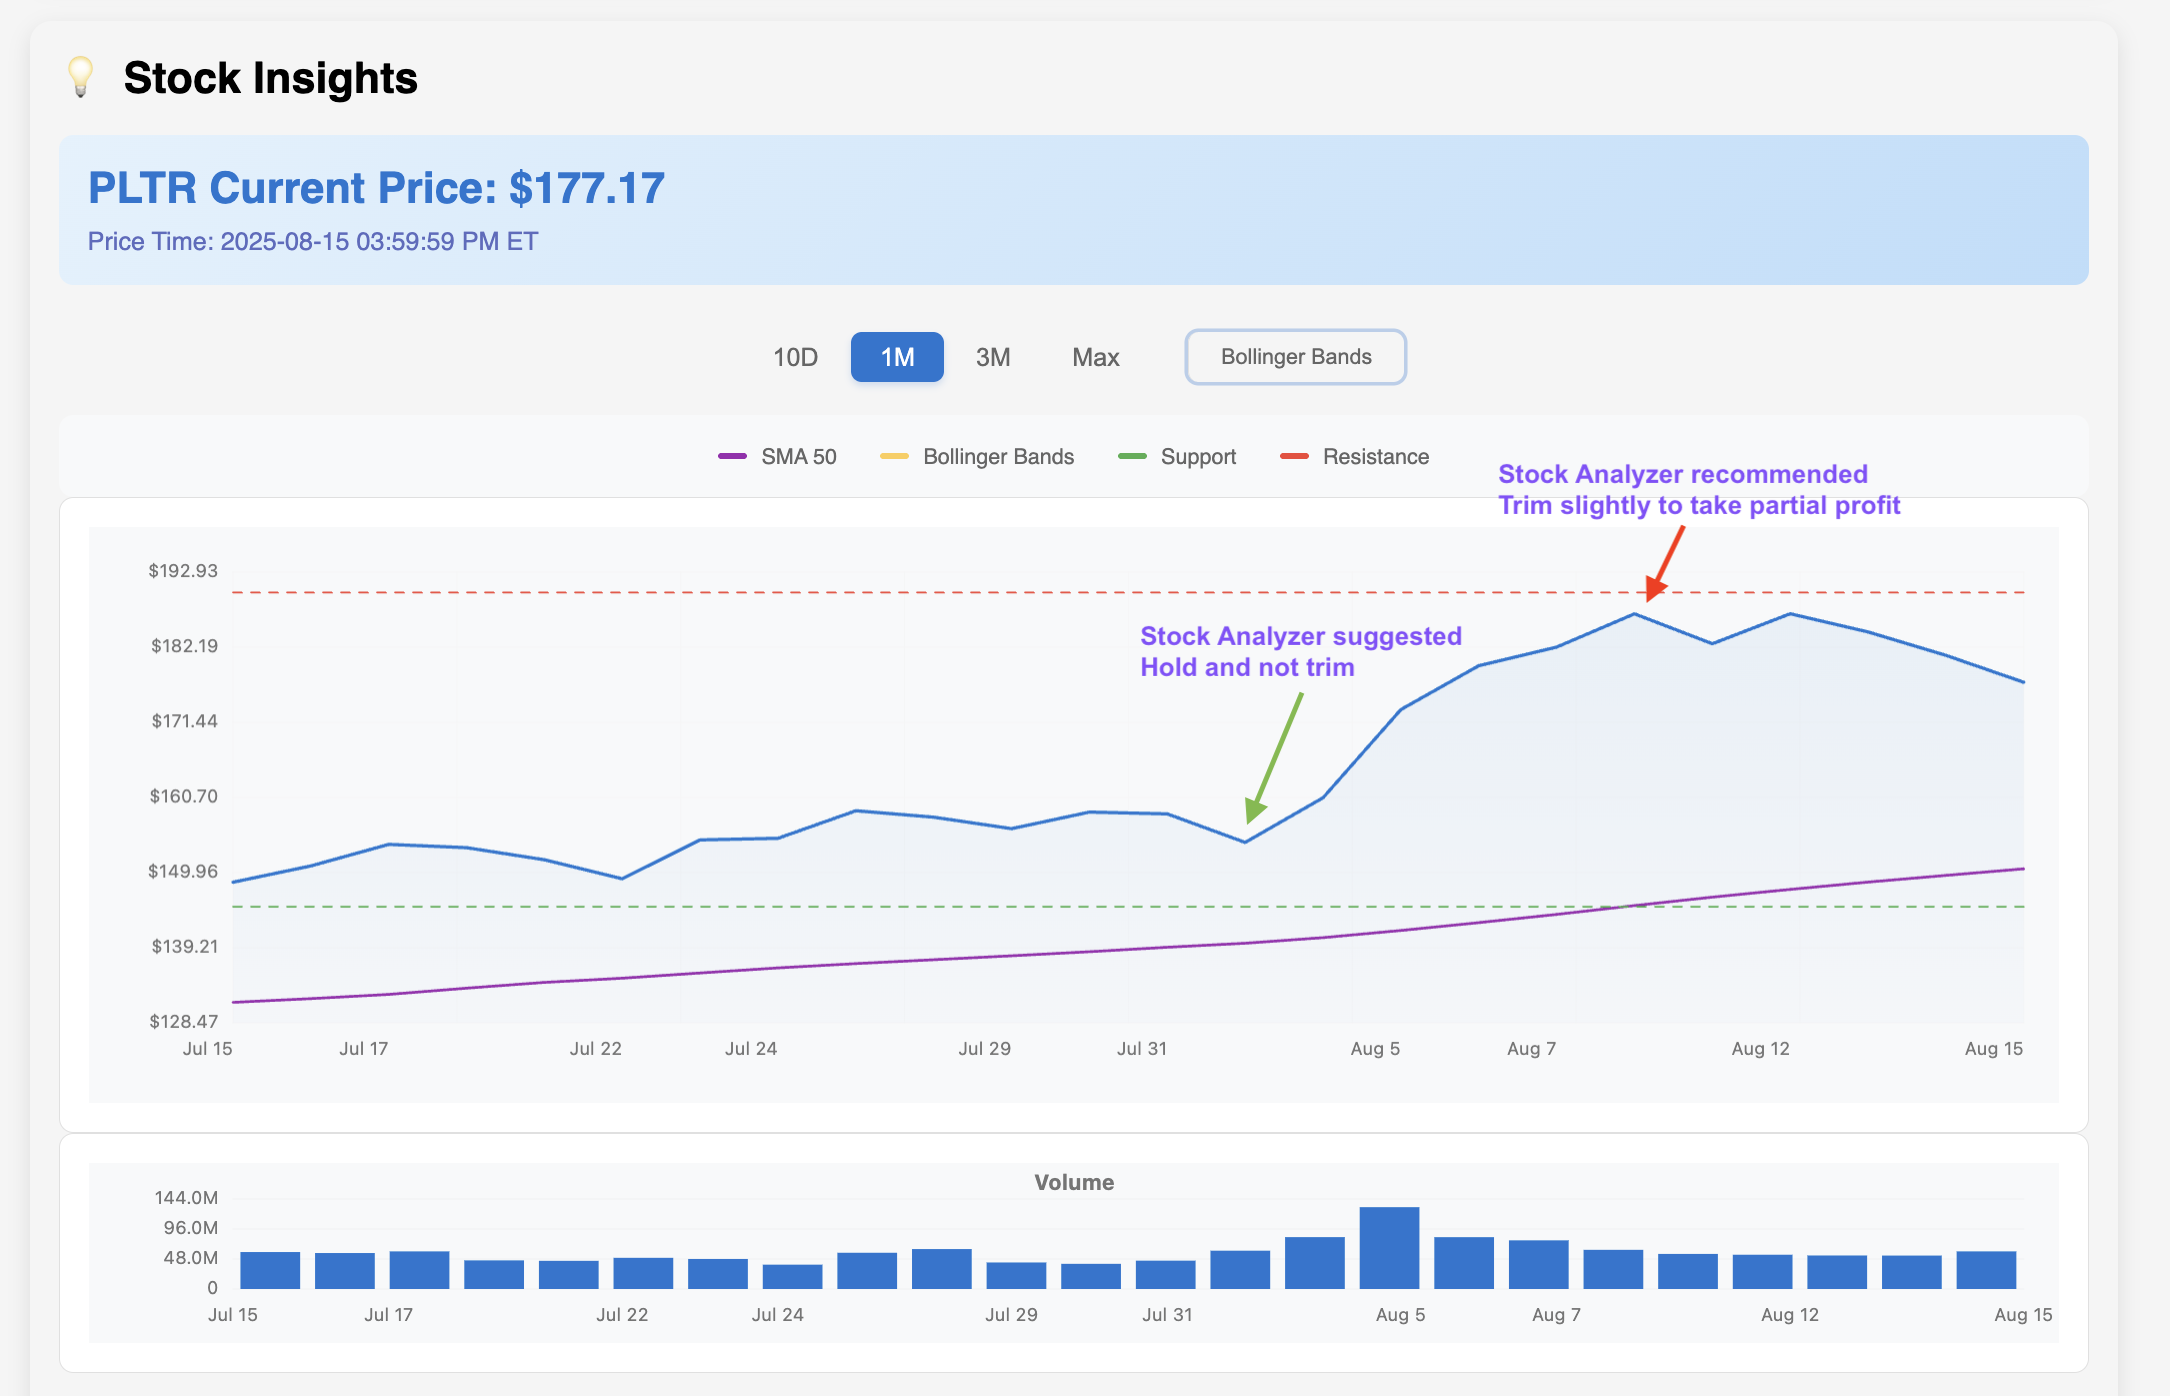
Palantir (PLTR)
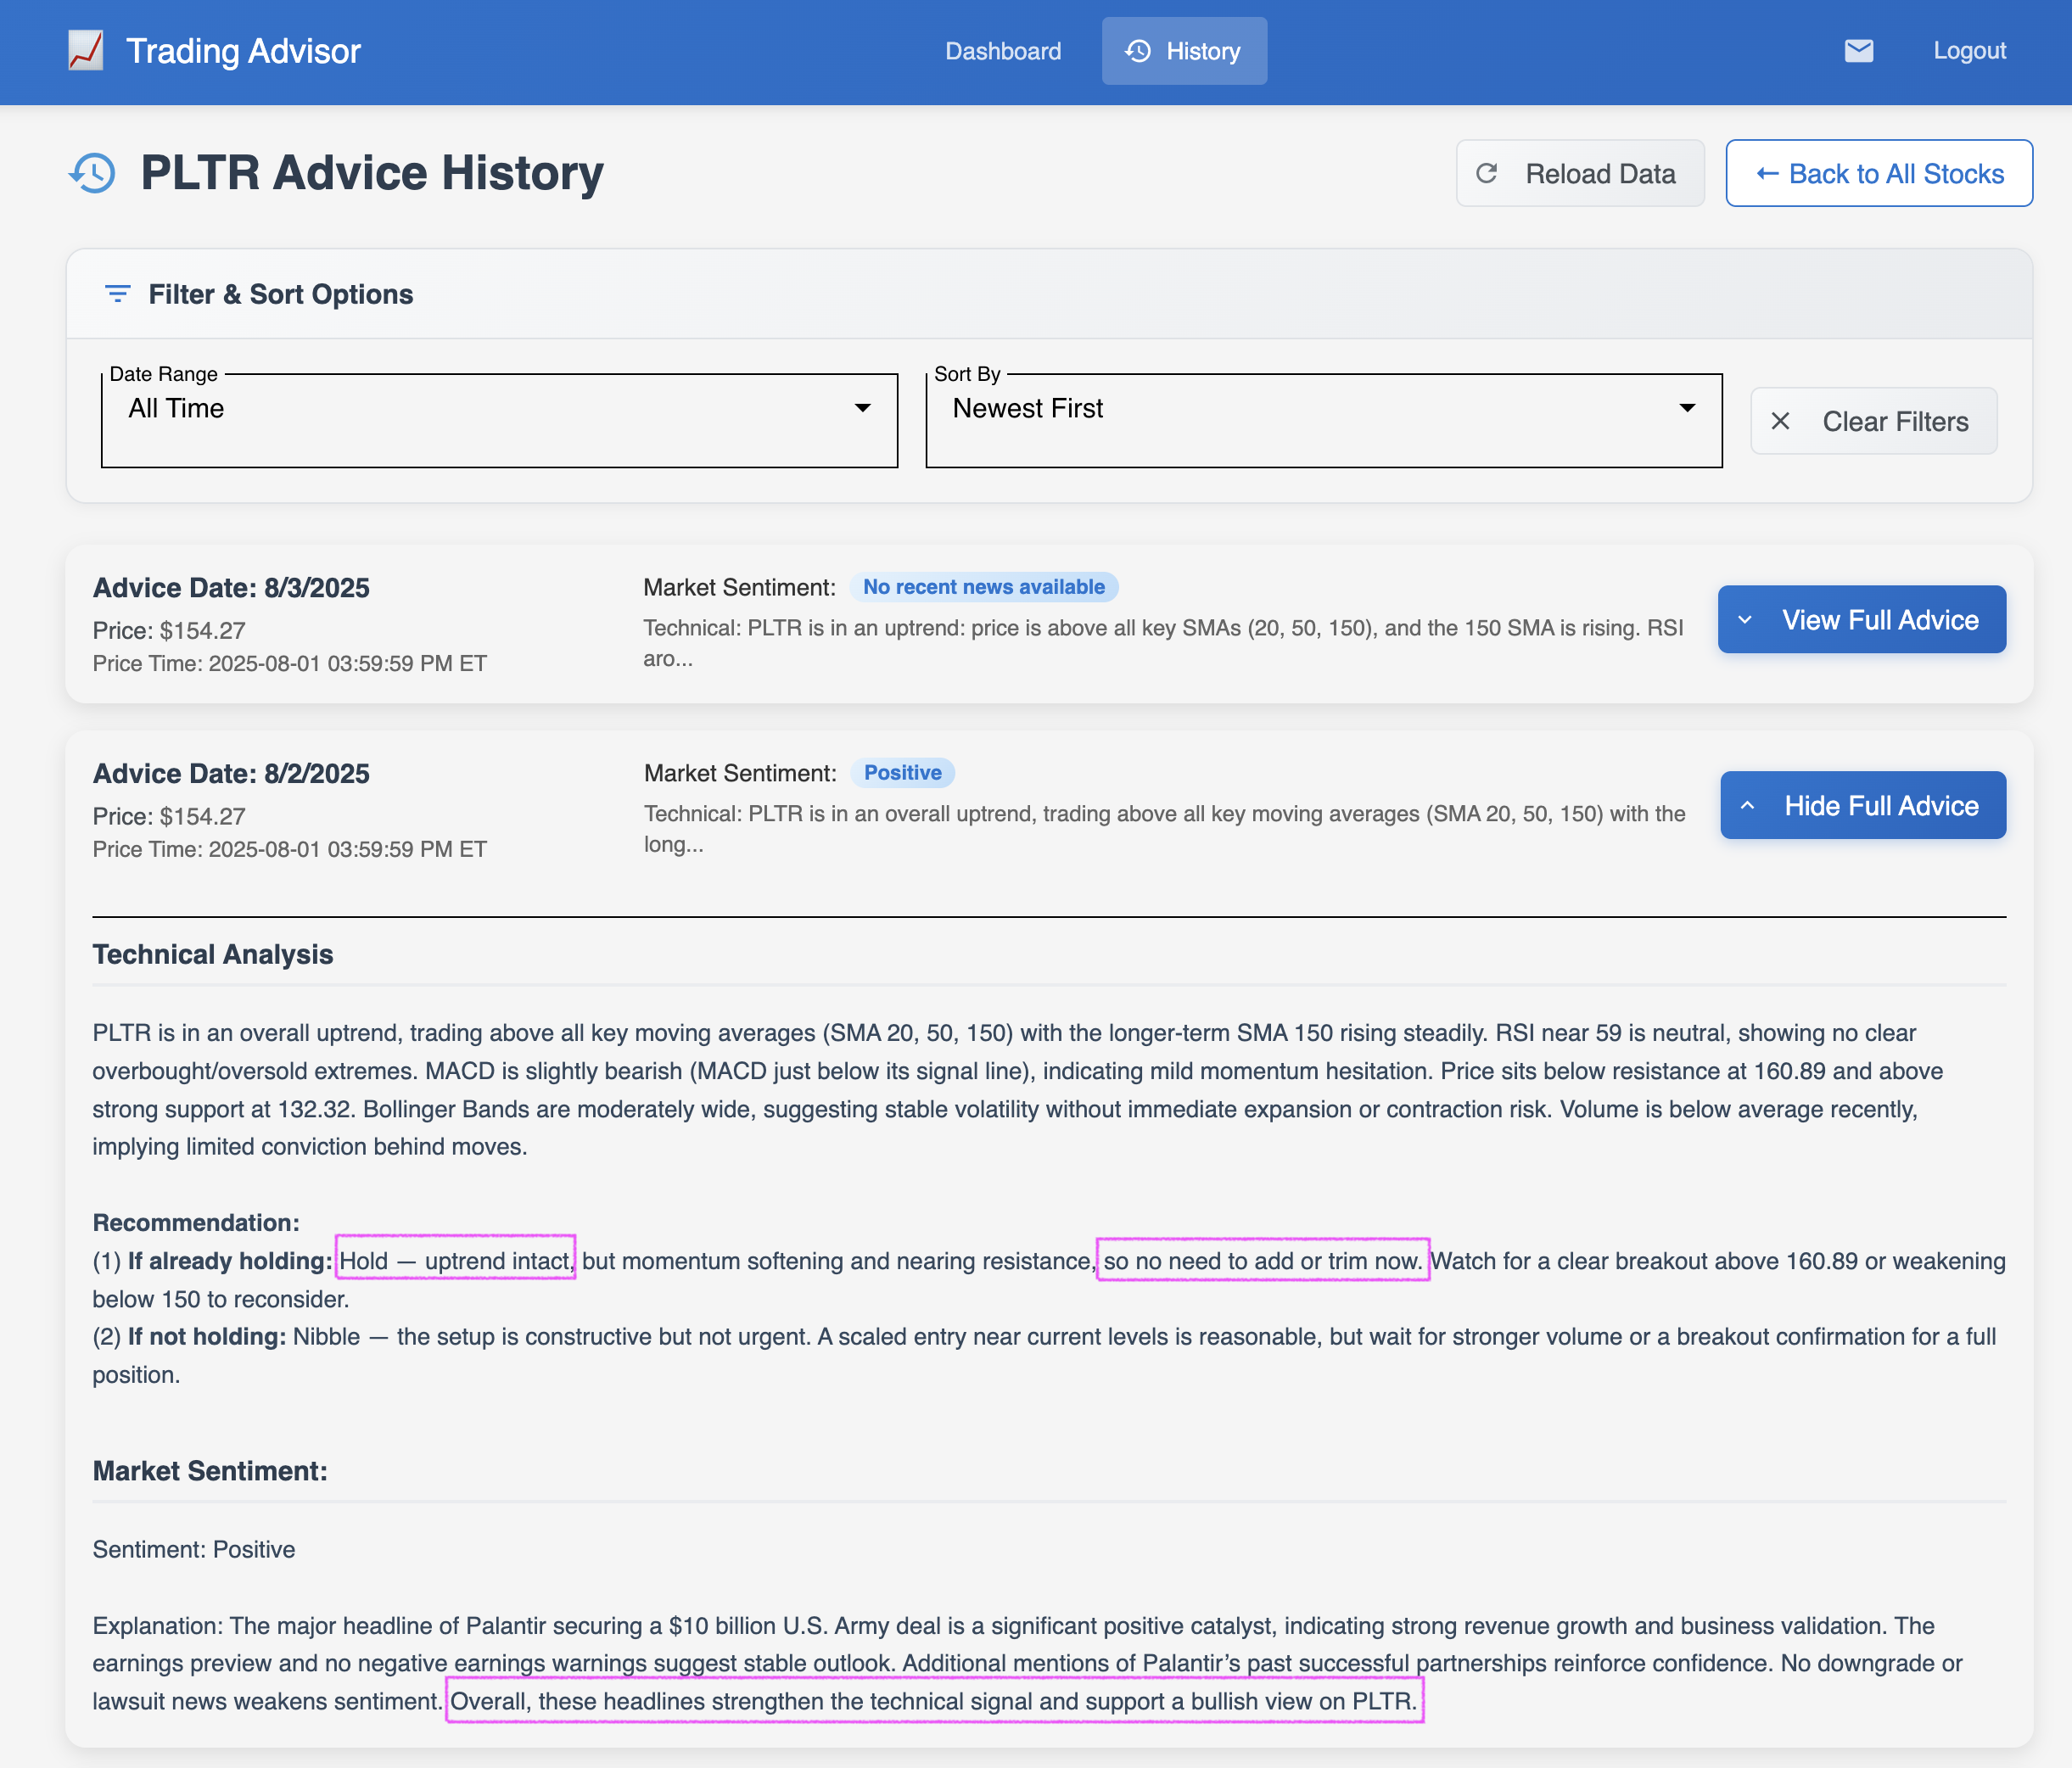
Two days before Palantir’s earnings report, the Stock Analyzer’s insights recommended holding the position and not trimming it. It also noted that news headlines reinforced the technical outlook and supported a bullish run. After the earnings report, PLTR stock surged by 22%, from $154 to $188.
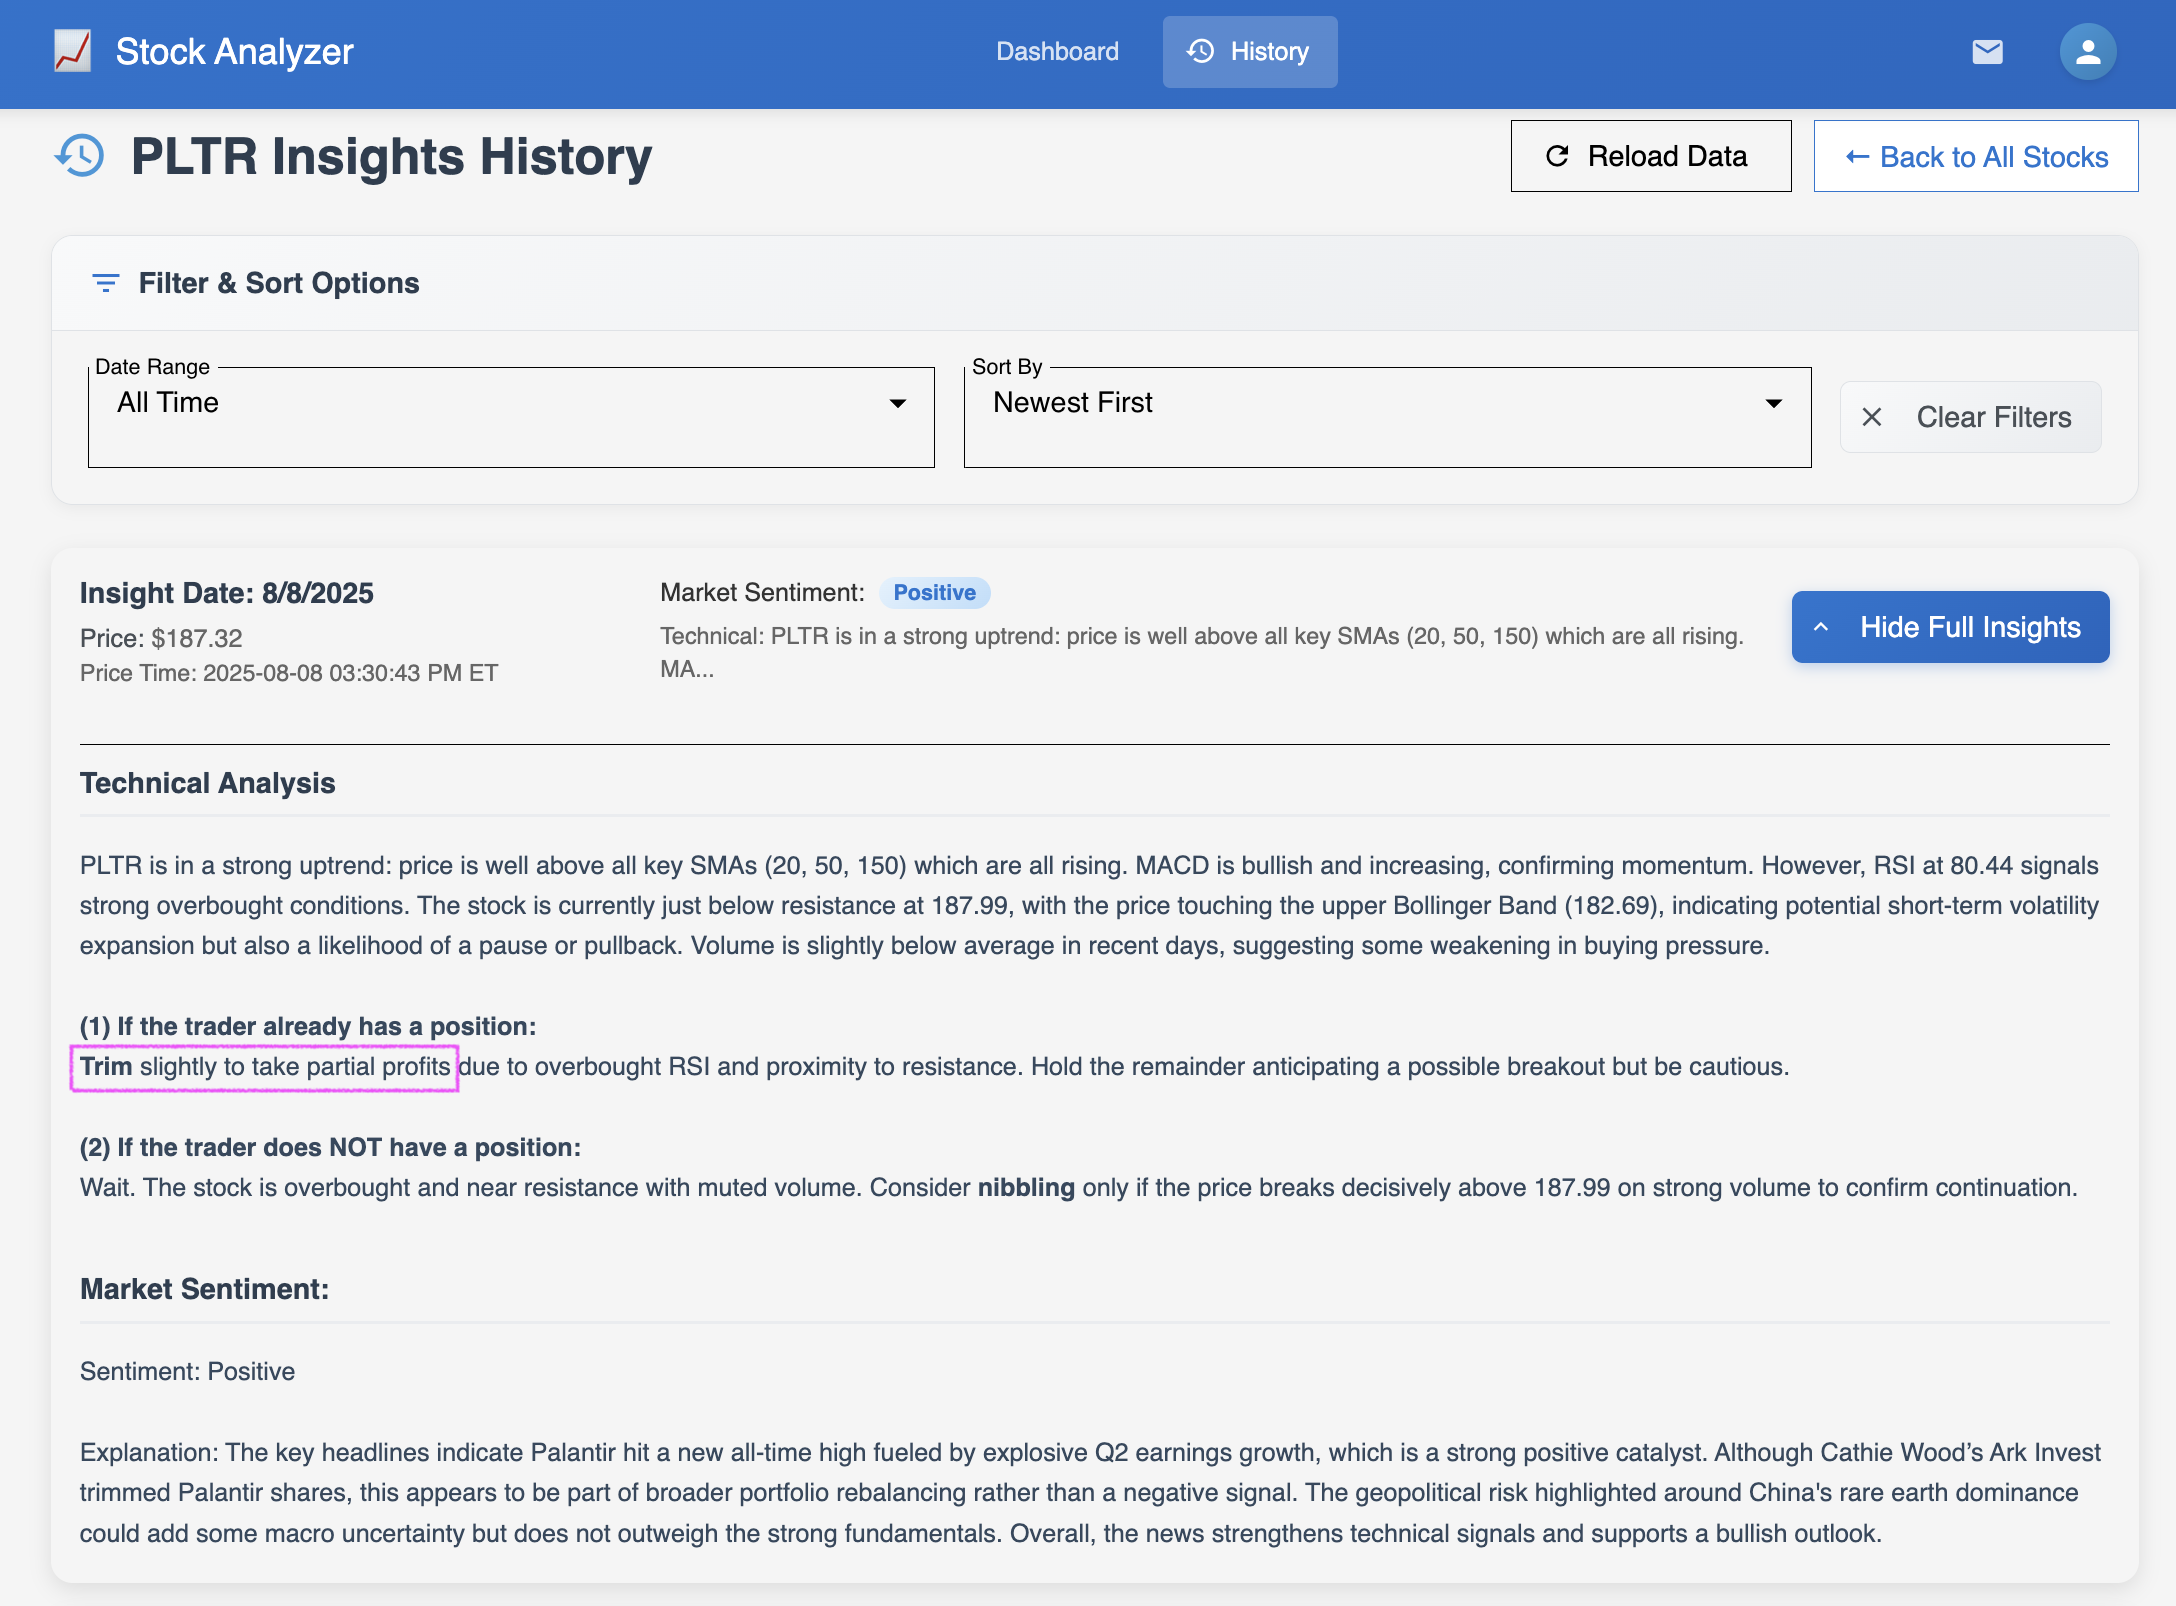
Then, on Friday, August 08, the Analyzer recommended that I trim slightly and take some profits because the stock was strongly overbought. One week later, the stock dropped 6% to $177. Ten days later, on August 19, PLTR sits at $157, 16% down from the price point where the Stock Analyzer recommended trimming.
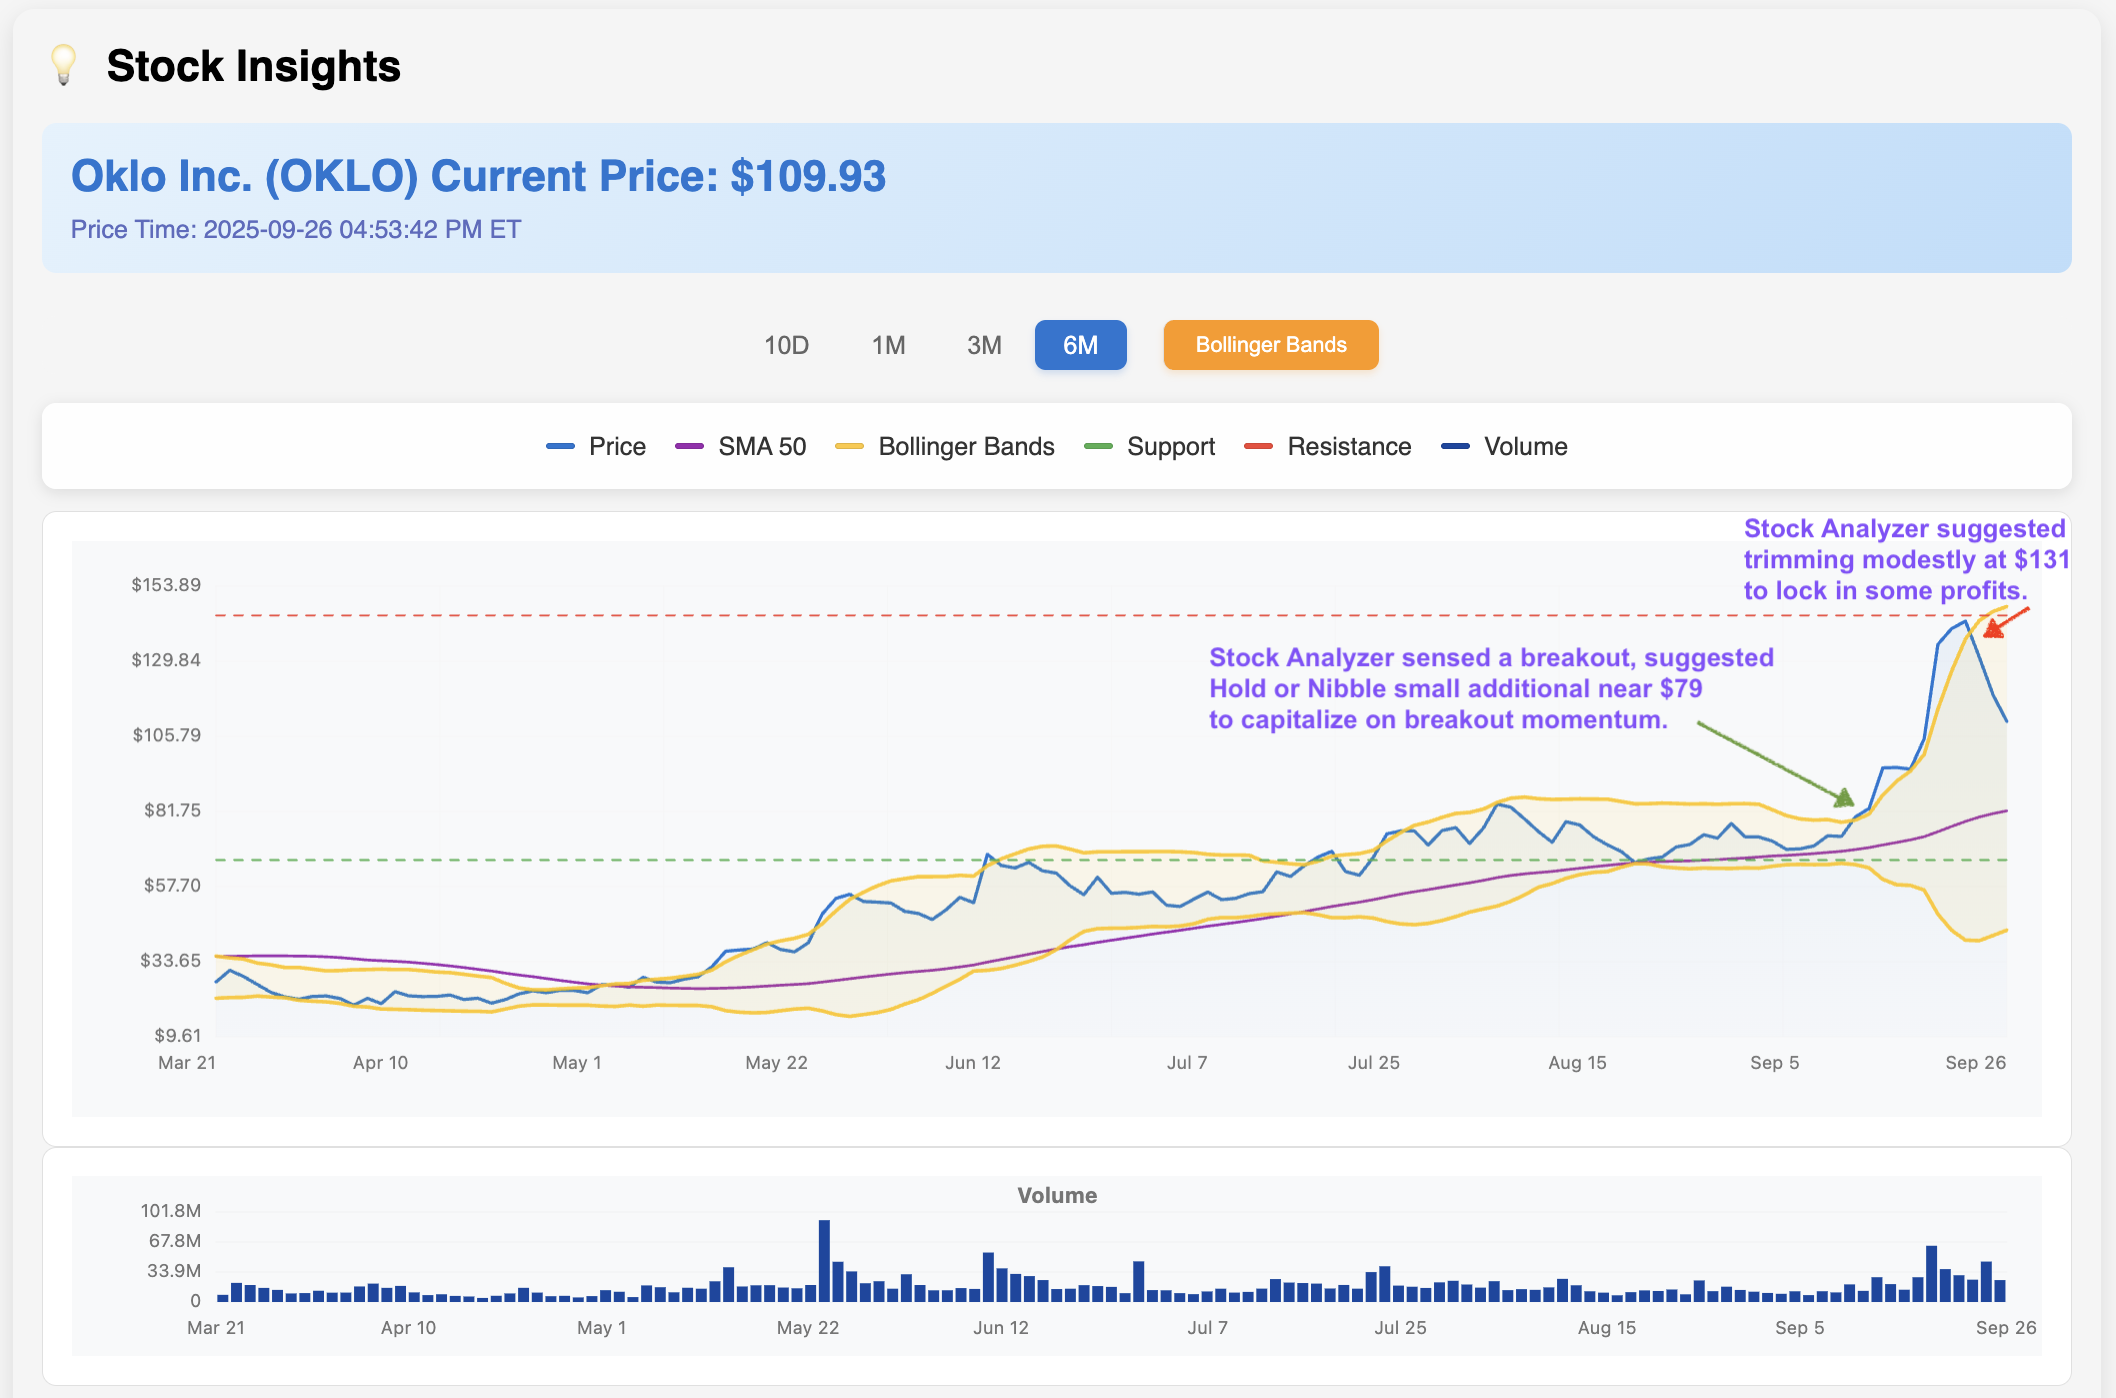
Oklo Inc. (OKLO)
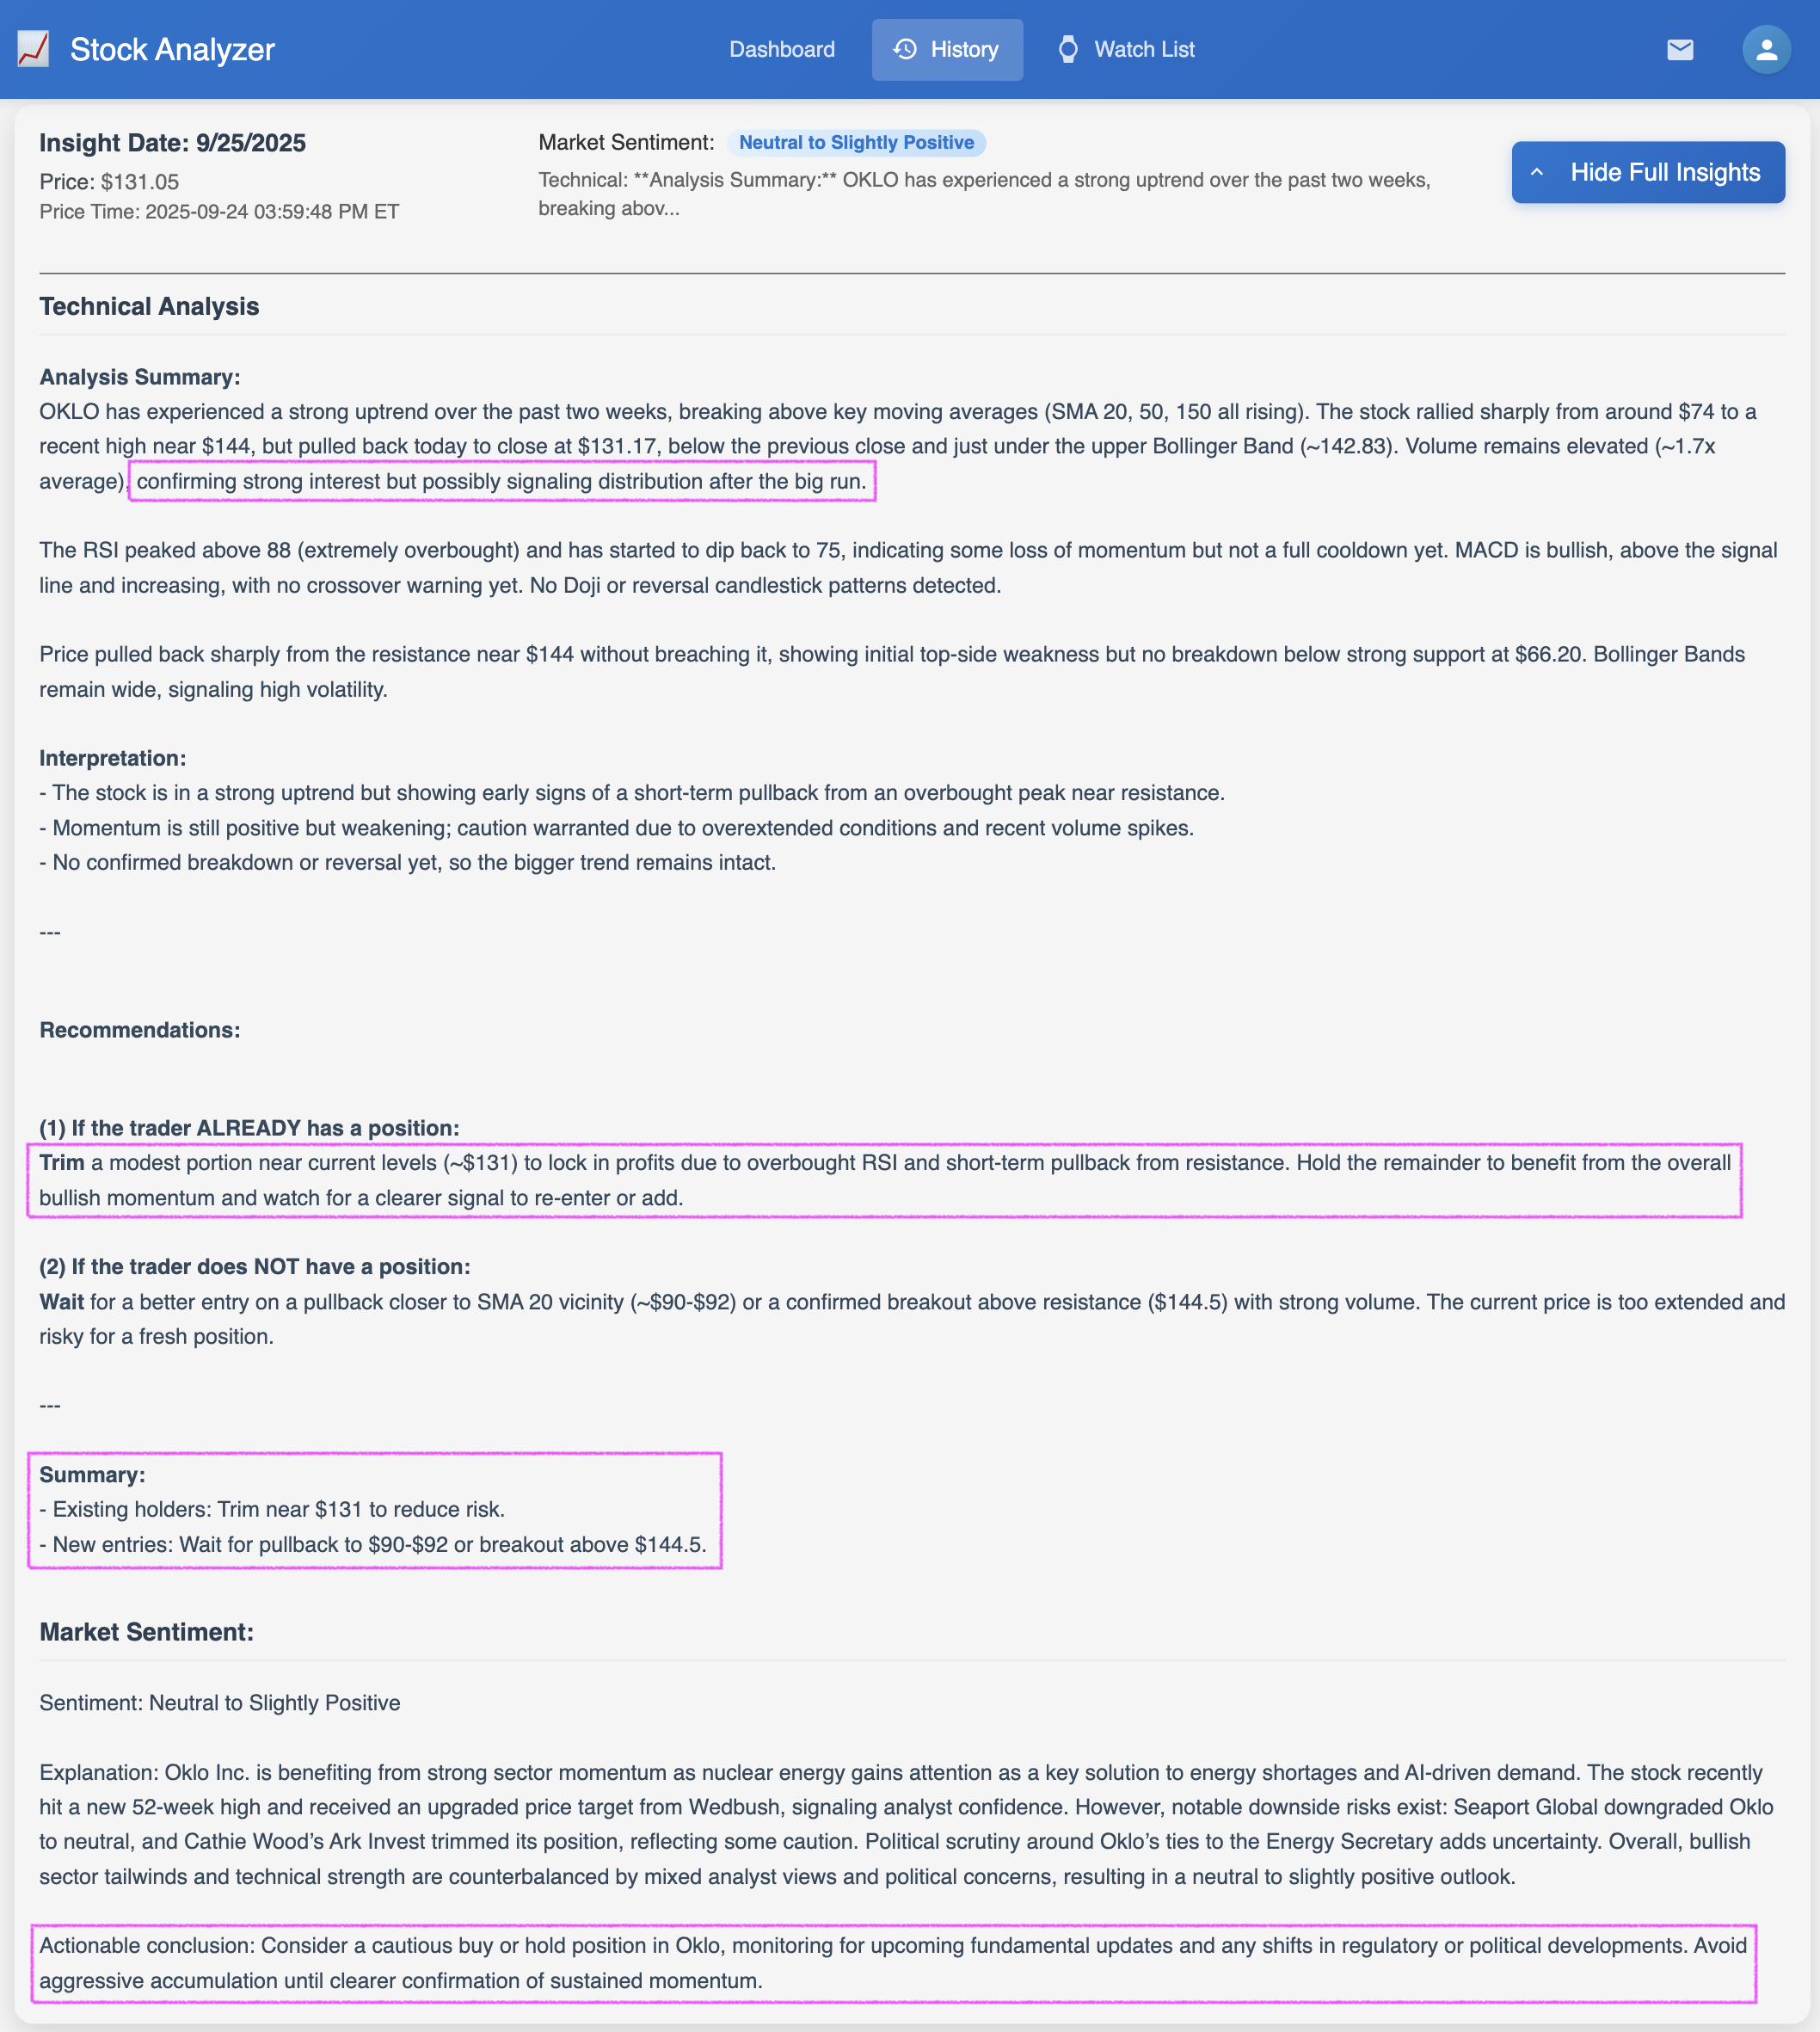
On September 25, the Stock Analyzer Agent recommended that I trim my OKLO position modestly at $131, as the OKLO chart indicates a loss of momentum and signals a potential distribution following the big run.
This proved to be a very helpful tip. The OKLO stock fell more than $21, closing at $110 over the next two trading days. Additionally, CNBC later reported that “Oklo has also seen a cluster of insider selling over the past few days”, which matches my AI agent’s speculation based on the chart.
Cheers!